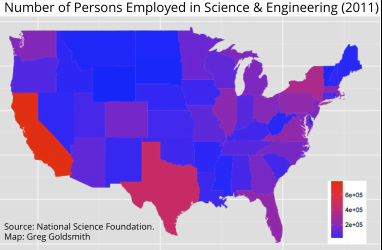
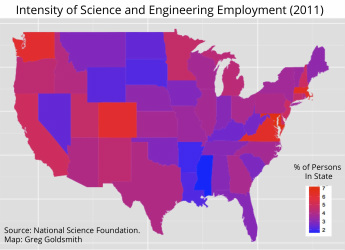
  | If you are contemplating a career in science, then you have good reason to be interested in the new report from the National Center for Science and Engineering Statistics on the geographic concentrations of scientists and engineers in the United States. From my perspective, it's a particularly interesting indicator of where one is most likely to find a job. The report, based on 2011 Census Bureau data, has some intuitive findings and some less than intuitive findings. For instance, California, Texas and New York account for more than 1/4 of all the scientists and engineers in the country, but they are also the three most populous states. However, when you correct for what is described as 'employment intensity,' the proportion of those employed in science and engineering jobs, the picture changes dramatically. In that instance, the District of Columbia, Massachusetts, Virginia, Colorado and Washington have the highest numbers. However, when one considers major defense contractors (e.g. Huntington Ingalls, Lockheed Martin, Boeing) employing scientists and engineers, the numbers for Virginia and Colorado start to make more sense. |
There is also a fair amount of data provided at the level of major cities. With respect to the biological, agricultural and environmental life sciences, which is the occupational description most closely aligned with my work, the best areas are Boston, Montgomery County in Maryland, New York and San Diego. However, the report covers math and computer science, physical science, social science and engineering as well.
The data is only provided in tabular format in the report, so I've moved it into a very quick and dirty color gradient map for a better look see (units for top map are total number of people, units for bottom map are percent). Of course, the data are from the following:
Khan B. and J.C. Falkenheim. 2013. Regional Concentrations of Scientists and Engineers in the United States Arlington, VA: National Science Foundation, National Center for Science and Engineering Statistics
 RSS Feed
